A proprietary, independent methodology used to assess fleet capability and maturity, identify operational gaps, and prioritise improvements across five pillars — supported by the DATa® platform.
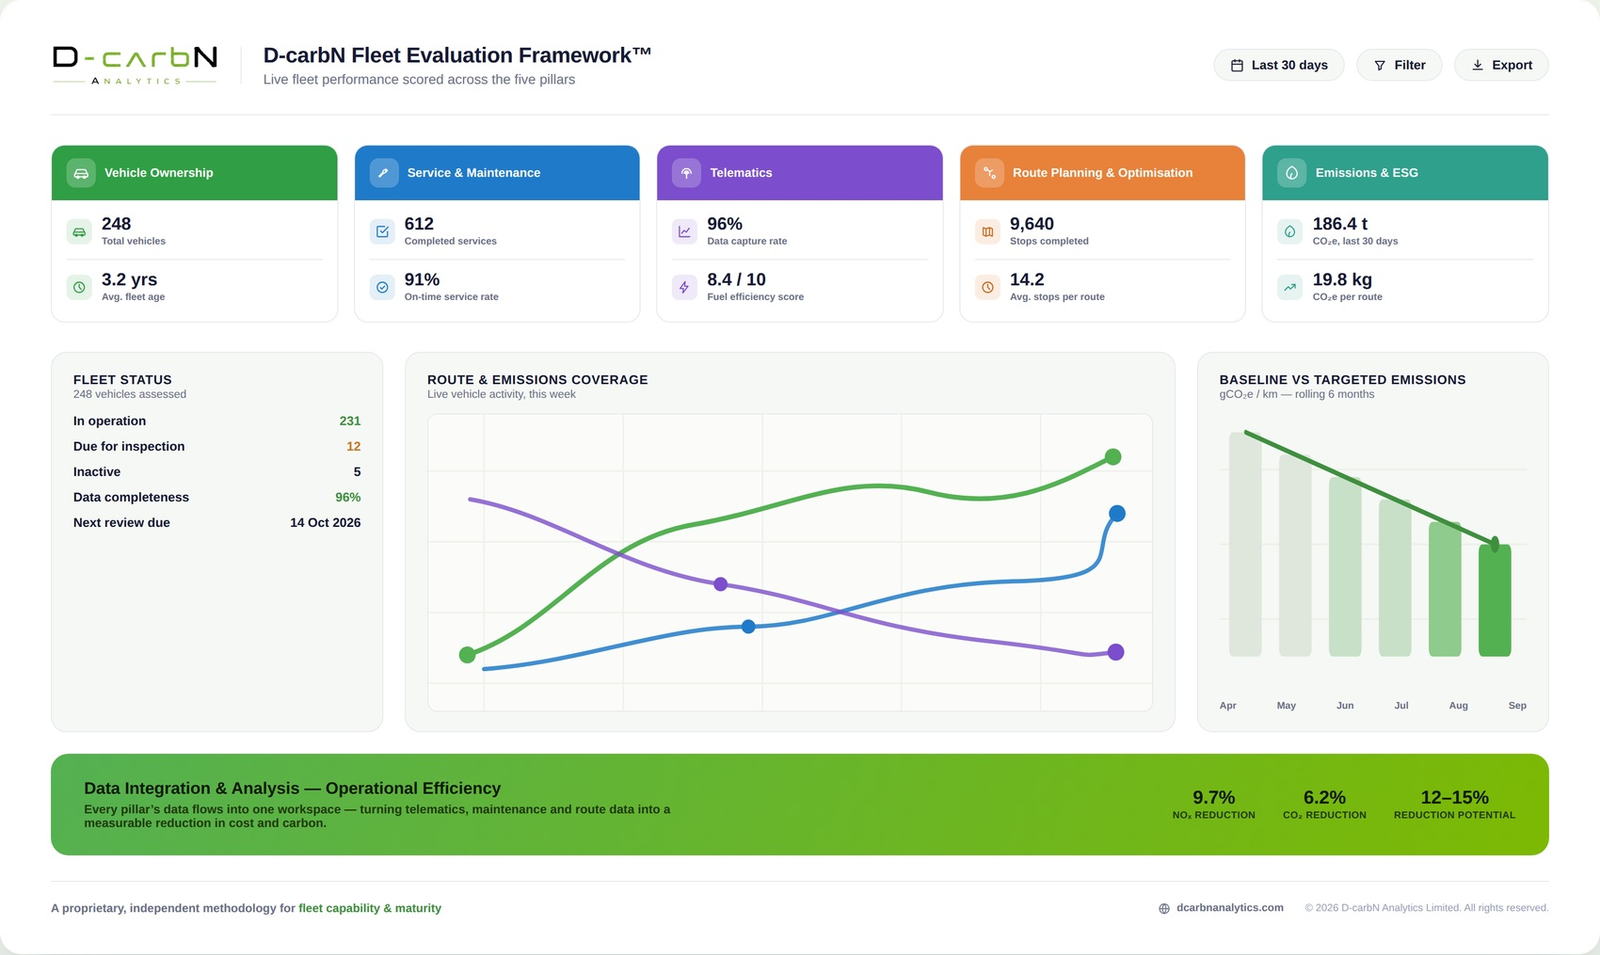
Illustrative example — a live operational view across the five pillars of the Fleet Evaluation Framework™
Vehicle acquisition & disposal, asset strategy & lifecycle, utilisation & availability, depreciation & residuals, insurance & compliance, governance & policies.
Planned maintenance, repairs & breakdowns, workshop management, parts & consumables, downtime & reliability, warranty & compliance.
Data capture & quality, real-time monitoring, driver behaviour, fuel & energy usage, location & tracking, alerts & diagnostics.
Route planning & design, load optimisation, capacity utilisation, empty-running reduction, time & resource efficiency, service performance (SLA).
Scope 1, 2 & 3 emissions, carbon reporting, fuel & energy efficiency, regulatory compliance, ESG disclosure, Net Zero readiness.
Every pillar rolls up into Financial, Operational and Environmental cost of ownership — better decisions, lower total cost, lower emissions, higher performance.

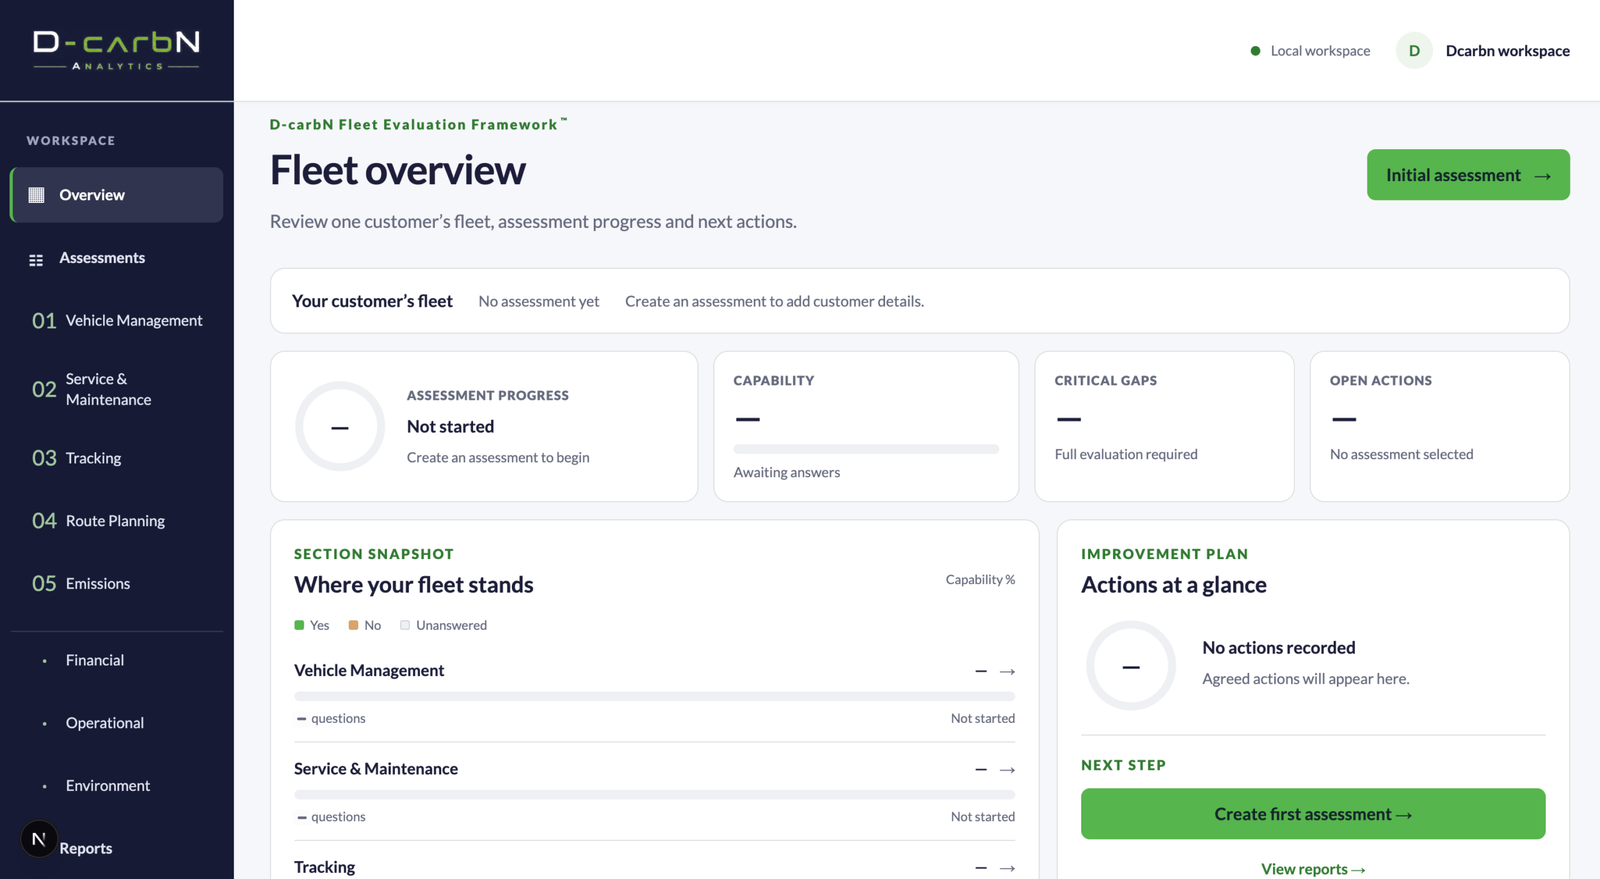
Every pillar, every question and every agreed action lives in a single fleet workspace — so progress, capability and critical gaps are always visible at a glance.
Fleet overview dashboard — question counts shown as “–” are placeholders pending final sign-off.
Every pillar is scored against a structured evaluation, built on documented evidence rather than self-assessment, and mapped to one of five maturity levels — giving a consistent, comparable view across the whole fleet.
No consistent process or documented evidence in place.
Reactive, ad hoc practices with limited records.
Documented, repeatable processes with clear ownership.
Actively managed, benchmarked and continuously improved.
Best-in-class, data-driven and externally verified.
The full scoring methodology — the specific evidence required at each level, for each pillar — is proprietary and shared as part of a Fleet Efficiency Review.
Every applicable question is answered Yes/No against documented evidence. The platform converts that into a capability percentage, a score-derived level, and gate pass/fail results — illustrated here with an example fleet.
| Pillar | Applicable Qs | Yes | Capability % | Score-Derived Level | Formal Level |
|---|---|---|---|---|---|
| Vehicle Management | 33 | 5 | 15% | 1 Foundation | Foundation |
| Service & Maintenance | 30 | 7 | 23% | 1 Foundation | Foundation |
| Tracking (Vehicle & Driver) | 32 | 21 | 66% | 3 Established | Foundation |
| Route Planning & Optimisation | 33 | 5 | 15% | 1 Foundation | Foundation |
| Emissions Tracking | 36 | 2 | 6% | 1 Foundation | Foundation |
Weighted across all applicable evaluation questions.
Based on the overall capability percentage.
Lower of overall score position and the weakest gated pillar.
Outstanding critical gaps requiring attention.
Illustrative example. Your fleet's assessment produces its own scorecard, gap analysis and prioritised improvement roadmap.
A short, evidence-based assessment across all five pillars — with a prioritised roadmap and estimated financial benefit.